The JPO conducted a comprehensive survey in May 2023 to summarize and analyze patent filing trends in green transformation (GX) technologies among respective regions and countries for the first time, referring to the JPO’s Green Transformation Technologies Inventory (GXTI). Green Transformation, aka “GX”, is a term initiated by the Japanese government to shift from industries that use fossil fuels to clean energy sources such as solar and wind energy, which do not emit greenhouse gases, in the aim of sustainable growth. It can be said that GX is an initiative that drives the use of green technologies to solve environmental issues and to transform socio-economic systems.
The JPO published the GXTI in June 2022 enabling easy analysis of patent information. Main categories of GX include energy saving in buildings, secondary battery, electromobility, solar photovoltaic power generation, fuel cell, electrification of heat, wind power generation, smart grid, hydrogen technology, etc.
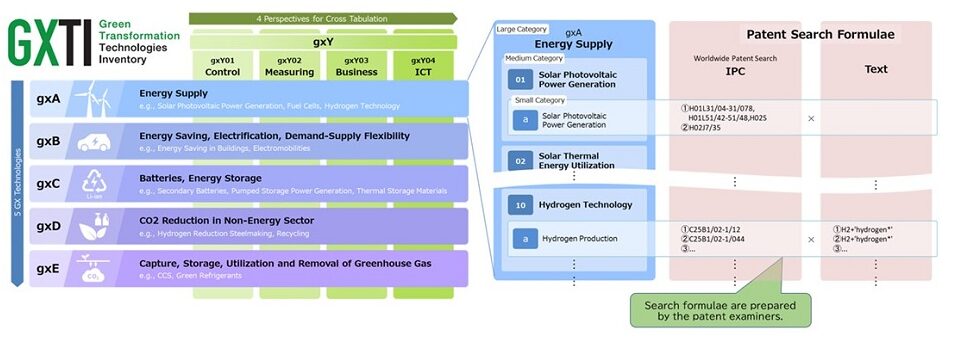
GXTI
GXTI categorizes GX-related technologies into five large categories of technology with four cross-sectional perspectives. Below is a figure of “Green Transformation Technologies Inventory (GXTI)” from the JPO website. The JPO also published search formulae with IPC codes and keywords that correspond to the cross-sectional technologies.
 [Search method]
Database: Derwent™ Innovation
Filing year based on the year of priority: between 2010 and 2021
Types of application: national entry to Japan, and PCT
Countries and regions: Japan, U.S.A., Germany, France, U.K., China, Taiwan, Korea, Canada, India, ASEAN, and Australia
[Definition of technical term]
- “Number of inventions” indicates the number of inventions filed in either of the above countries and regions. Even if one invention is filed in only one country or more than one country, it still counts as one.
- “Number of International Patent Families (IPFs)” indicates the number of inventions filed in more than one country or to the EPO, or under PCT route.
Search results
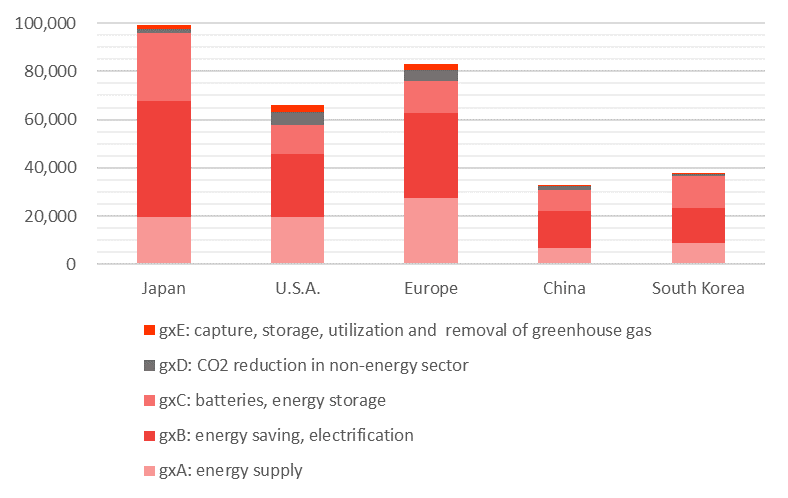
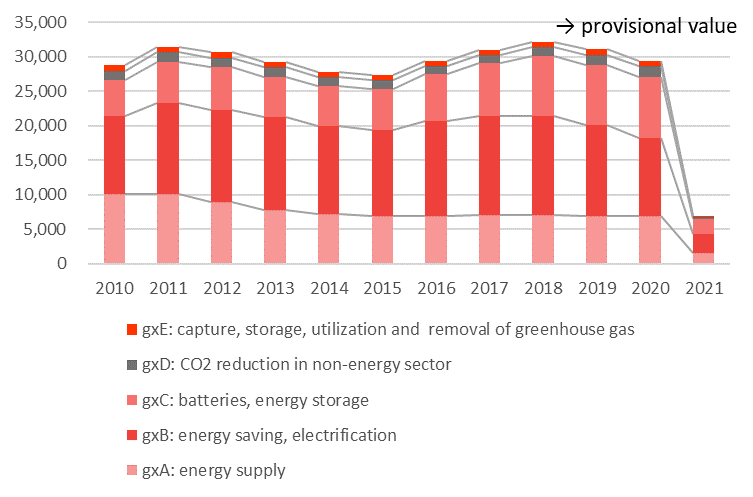
This survey analyzed GX technologies mainly in view of the number of inventions and IPFs. At a glance of the GX technologies as a whole, Japanese applicants are top filers of IPFs, particularly in gxB (energy saving, electrification) and gxC (batteries, energy storage). On the other hand, the number of inventions filed by European applicants is the largest in gxA (energy supply), while US applicants filed the largest number of cases in gxD (CO2 reduction in non-energy sector) and gxE (capture, storage, utilization and removal of greenhouse gas). China is the only country with drastically increasing GX filings, exceeding the previous top filer, Japanese applicants since 2013.
Trends in the number of IPFs in GXTI large categories
By country:
By year:
Total number of each category
The number accumulated the cases filed by all the countries and regions mentioned in the above search method.
gxA: 87,715 cases
gxB: 146,221 cases
gxC: 77,378 cases
gxD: 15,202 cases
gxE: 8,400 cases
GXTI medium category trends research
gxA01: solar photovoltaic power generation
The total number of IPFs in solar photovoltaic power generation has been decreasing from 4,000 in 2010 to over 2,000 in 2018. This may reflect the market trend that the industry may be shifting from the development of new technologies to its practical application. Japan has maintained the top position every year. China is the only country that the number of IPFs is increasing. Specifically, China is ranked in top three in ocean technology, wind power generation, hydro power generation, and utilization of solar thermal energy and biomass.
Examining the accumulated IPF numbers between 2010 and 2021, US applicants filed 359 cases at the largest number, while Japanese applicants filed 182 cases, European applicants filed 102 cases, Korean applicants filed 97 cases, and Chinese applicants filed 59 cases. Looking closely at the numbers between 2018 and 2021 (see the table below), Kaneka, one of the Japanese leading chemical companies, climbs sharply in recent years. US applicants have been unranked while Chinese applicants have increased.
Top 10 applicants in the number of IPFs between 2018 and 2021
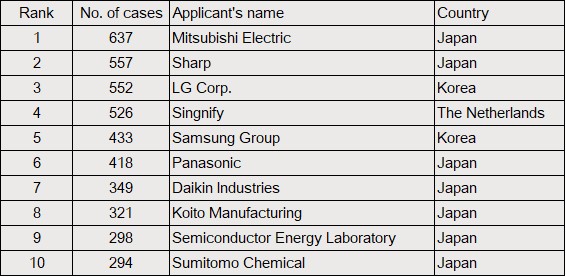
gxB01: energy saving in buildings (ZEB, ZEF, etc.)
Total number of IPFs in energy saving in buildings remained around 7,000 between 2010 and 2021. The number of cases filed by Japanese applicants are 2,500 on an annual average, considerably exceeding European applicants in the second place with 1,500 cases on an annual average. Japanese applicants accounted for 7 out of top 10 in the table between 2018 and 2021. Mitsubishi Electric has ranked in the first place since 2014. Daikin Industries, Koito Manufacturing, and Sumitomo Chemical have filed more applications year by year.
Top 10 applicants in the number of IPFs between 2018 and 2021
gxC01: secondary batteries
The total number of IPFs has marked a significant increase from less than 5,000 in 2010 to over 7,500 in 2018. The trend may reflect the fact that global companies put their efforts into developing secondary batteries, which are rechargeable. Japanese applicants are by far top of the ranking.
Top 10 applicants in the number of IPFs between 2018 and 2021
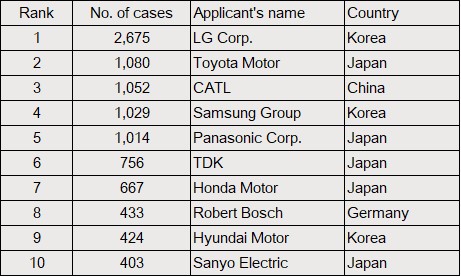
Business fields of applicants listed in the above ranking range from battery, electric to automobile. With the advent of electrification in society, secondary batteries, especially all-solid-state batteries for EVs, draw attention from industry. Those companies have engaged in fierce competition in the market.
gxD01: chemical production from biomass
In this category including biomass plastics and cellulose nanofibers, the total number has edged up and down at around 1,000 every year between 2010 and 2018. US applicants annually filed less than 500 cases between 2010 and 2012. Since 2016, the number dropped to 300 cases, which is the same as European applicants. The number of IPFs by Japanese applicants remained around 100. On the other hand, Chinese applicants are rising in its number.
Top 10 applicants in the number of IPFs between 2018 and 2021
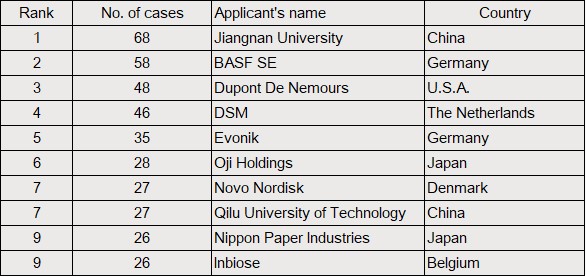
Chinese applicants were unranked between 2010 and 2013; however, they have been ranked between 2018 and 2021. Jiangnan University topped the table, increasing its number from 37 between 2014 and 2017. This shows remarkable presence of Chinese applicants. Unlike other tables, some applicants in gxD01, are Nordic applicants, universities, and research institutes.
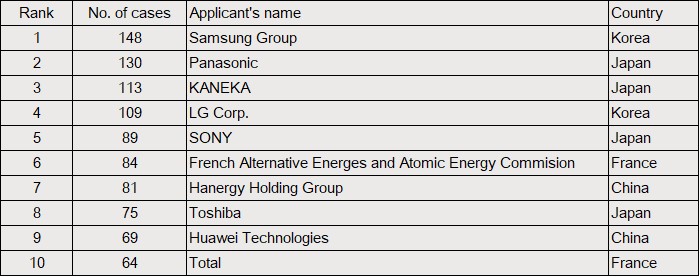
gxE01: CCS, CCUS, negative emission
The total number of IPFs stayed flat at around 600 annually. US applicants have been decreasing to 200 while European applicants have also been decreasing to below 200. The number by Japanese applicants remained unchanged at around 100 to 150.
Top 10 applicants in the number of IPFs between 2018 and 2021
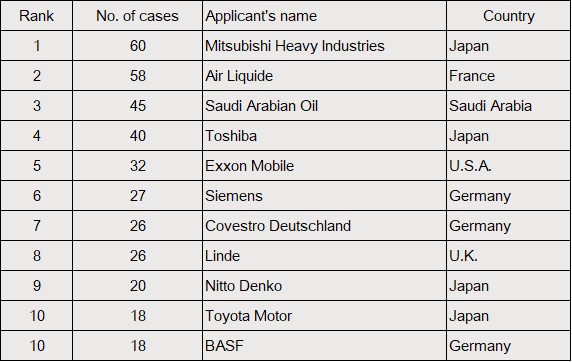
Automobile manufacturers have been ranked in the table. Japan, U.S.A., Europe, and Saudi Arabia have taken the lead in this technology.
Our analysis
Among the above GX technologies, the number in gxC01: secondary batteries is on the drastic rise as automobile and battery makers ventured into the EV market. It is expected that this increasing trend continues while research and development on all-solid-state batteries are accelerating. Although some of the medium category trends show that electric and heavy industry companies have occupied the tables, it is worthy to note that applicants from variety of the industries filed applications related to GX technologies. It is hoping that more and more companies will file their applications in those technical fields to tackle climate change challenges.
[Reference]
Overview of the Results of Patent Information Analysis Based on GXTI Japan Patent Office (jpo.go.jp)
https://www.jpo.go.jp/e/resources/statistics/gxti/overview-results_patent-analysis.html
Patent Information Analysis Based on GXTI (Summary Version), October 2023, JPO
https://www.jpo.go.jp/e/resources/statistics/gxti/document/overview-results_patent-analysis/slide_overview_analysis.pdf